
Mastering HubSpot Lead Scoring for Better Lead Quality
 By
Ryan Clark
·
3 minute read
By
Ryan Clark
·
3 minute read
If your marketing team is generating plenty of leads but your sales team is struggling to convert them, you’re not alone. Many organisations find themselves caught in a misalignment gap where the volume of leads grows, but the clarity around which leads deserve attention does not. The problem isn’t usually the number of leads, it’s the lack of a shared, structured definition of what a qualified and sales ready lead looks like. transformative.
Why the A1 - C3 Lead Score Matrix Matters
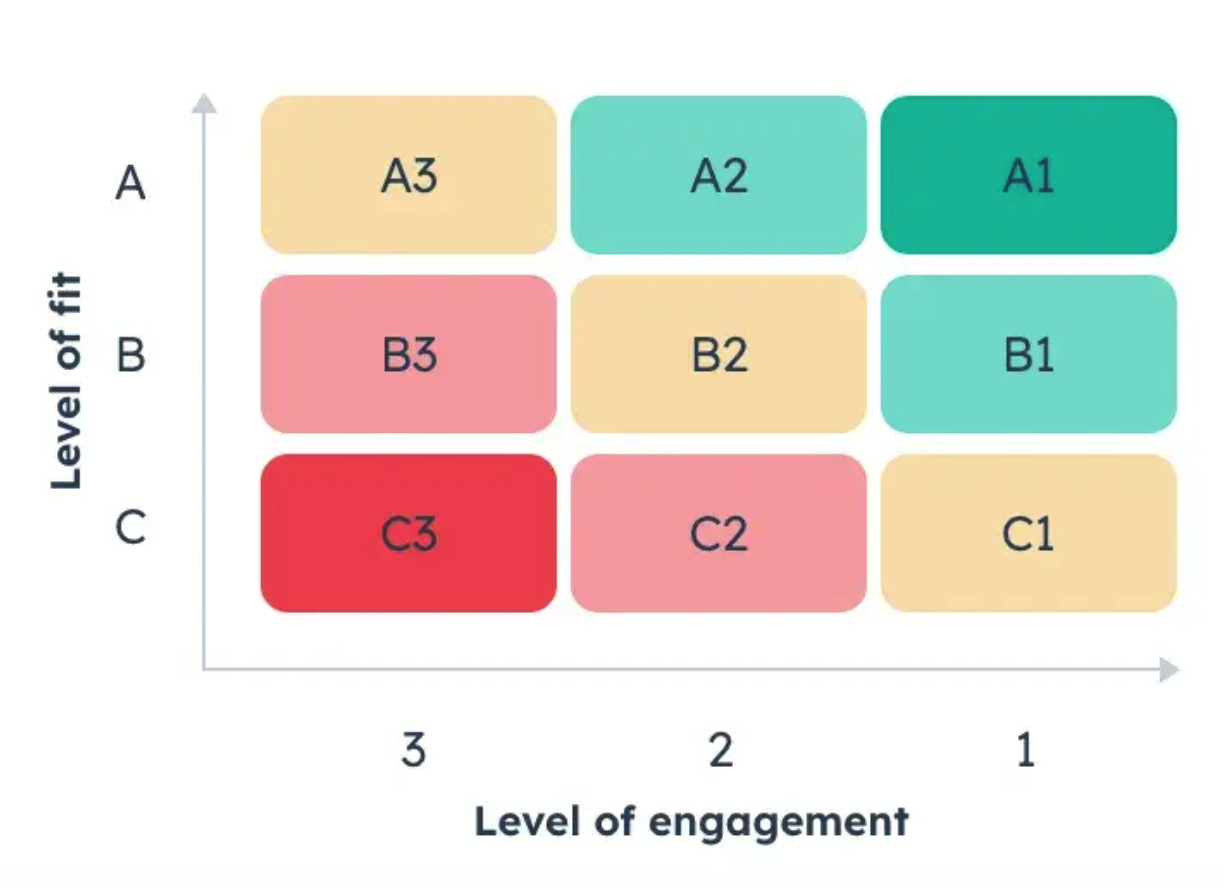
While HubSpot does an excellent job of adding and tracking individual points, numbers alone can be messy. A lead with 75 points might be valuable, but without a framework, your teams may interpret that score differently. The A1 - C3 matrix turns this complexity into clarity by converting raw scores into meaningful categories.
The matrix uses three levels of Fit - A, B, and C and three levels of Engagement - 1, 2 and 3. When these levels intersect, you get nine distinct lead categories. For example, an A1 lead is someone who is both an excellent Fit and highly engaged. This is the gold standard lead that sales should contact immediately. Conversely, a C3 lead is someone with low Fit and low Engagement, indicating that they are not a priority for sales and should remain in automated nurture or archived.
By assigning each lead to a category from A1 to C3, you create a shared language that helps both marketing and sales understand exactly what stage a lead is in and what should happen next. The model simplifies communication and ensures every lead receives the appropriate level of attention.
How to Build the A1 - C3 Matrix Inside HubSpot
You will need a marketing pro subscription to build the scoring model, then navigate to Marketing > Lead Scoring. Then, you want to start by building this matrix is establishing clear scoring rules for Fit attributes. For instance, you might give additional points to leads in your target industry or to decision makers within an organisation. At the same time, you may assign negative points to attributes that suggest a poor Fit, such as competitors or student email addresses. This ensures that your scoring system rewards ideal characteristics and filters out those with little potential.
Next, you’ll define your Engagement scoring criteria. High intent actions like booking a demo or viewing a pricing page should carry the greatest weight, while smaller engagements such as email opens or blog views receive fewer points. This prevents minor interactions from inflating the perceived readiness of a lead.
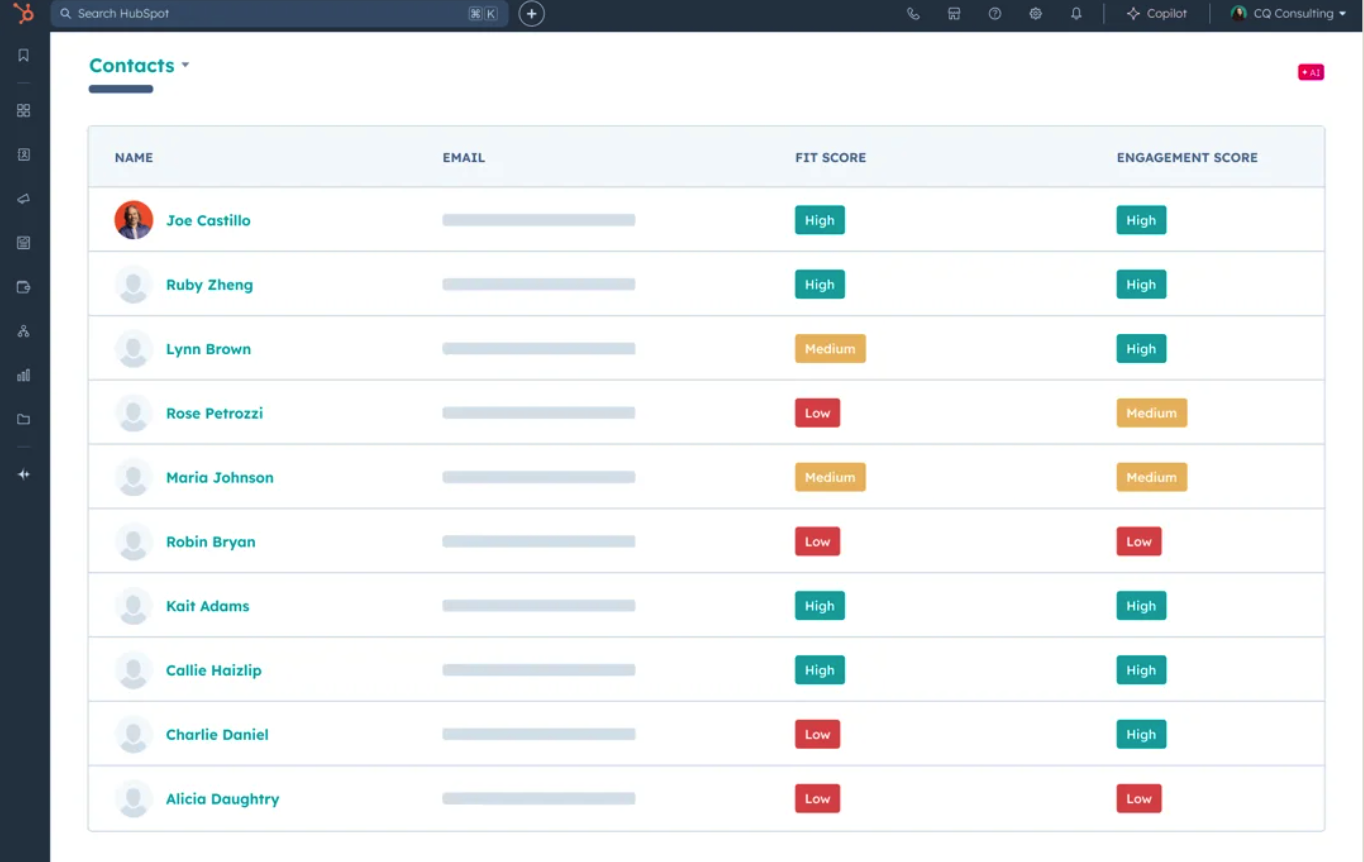
Once Fit and Engagement scores are calculated, you define the thresholds that determine whether each score falls into a high, medium, or low bucket. A simple way to do this is to estimate the maximum possible points for each score and then apply percentage based cutoffs: 70% or higher is considered high, 40 - 69% is medium and below 40% is low. These buckets then combine to create the A1 - C3 matrix categories.

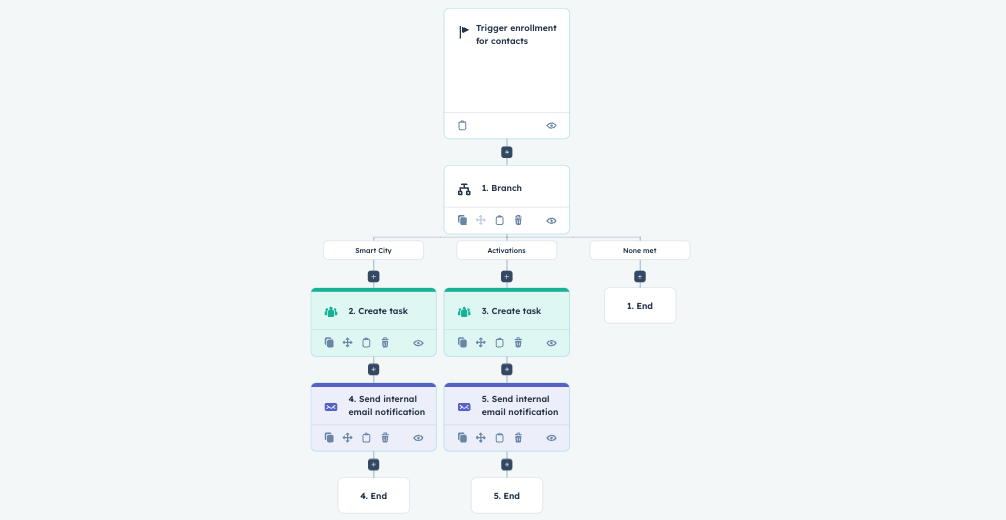
How the A1 - C3 Matrix Improves Lead Handover
One of the most biggest benefits of implementing a lead scoring matrix is the improvement it brings to the lead handover process. In many organisations, the transition between marketing and sales is vague or inconsistent. Marketing may send too many low quality leads, while sales may complain about lead quality without offering actionable feedback. The A1 - C3 matrix removes this ambiguity.
With clearly defined categories, sales teams know exactly which types of leads they should prioritise. For example, A1 and A2 leads can be designated as sales ready, meaning they automatically flow into the sales queue. Meanwhile, leads ranked B2 through C3 remain under marketing’s care, where they can be nurtured through targeted content and engagement workflows.
This clarity speeds up response times, reduces miscommunication and ensures that no qualified lead slips through the cracks. Sales receives fewer but higher quality leads, which increases confidence in the handover process and results in better conversion rates. Marketing, at the same time, can focus on developing nurture strategies that gradually move lower scoring leads into higher scoring categories. There is also an opportunity to enrich the data, as someone could be super engaged, but low on fit due to missing data points.
How to Truly Master Lead Scoring
Mastery of lead scoring isn’t just about setting it up once and forgetting about it, it’s about refining and evolving your model as your business and your buyers change. This includes regularly reviewing your scoring rules to ensure they still reflect real world conversion patterns. It also means collaborating with your sales team, who often have front line insights into which leads are genuinely valuable.
Predictive tools within HubSpot can help you identify hidden behaviours or attributes that signal a high quality lead. Meanwhile, incorporating negative scoring for example, for long periods of inactivity or non ICP attributes, helps keep your CRM healthy and prevents your sales team from wasting time.
Ultimately, mastering lead scoring requires a balance of data, intuition and continuous improvement. The A1 - C3 matrix provides the structure, but your willingness to test, analyse and optimise will determine your long term success.
Final Thoughts
HubSpot lead scoring is more than a technical process, it’s a system that enhances alignment, improves productivity and strengthens the connection between marketing and sales. When paired with the A1 - C3 matrix, lead scoring becomes a powerful tool for prioritising leads, refining messaging and creating a predictable path for growth.
By converting complex data into simple categories, you make it easier for both teams to work together, focus on the right opportunities and ensure that every lead is treated appropriately. The end result is a more efficient funnel, a smoother handover process and a more confident sales team, exactly what you need to generate consistent, predictable revenue.